Solar Forecast: Installations, Prices, Employment and the Future
All information from SEIA/GTM Research “U.S. Solar Market Insight: Q1 2013” unless noted otherwise.
Since publishing its first quarterly findings in 2010, the Solar Energy Industries Association has documented and forecasted the volatile environment of the U.S. solar market and evaluated its implications for the energy industry at large. The report, which breaks down the solar industry into three segments: residential, non-residential and utility, measures installation growth, price decline, economic progress and forecasts future market conditions.
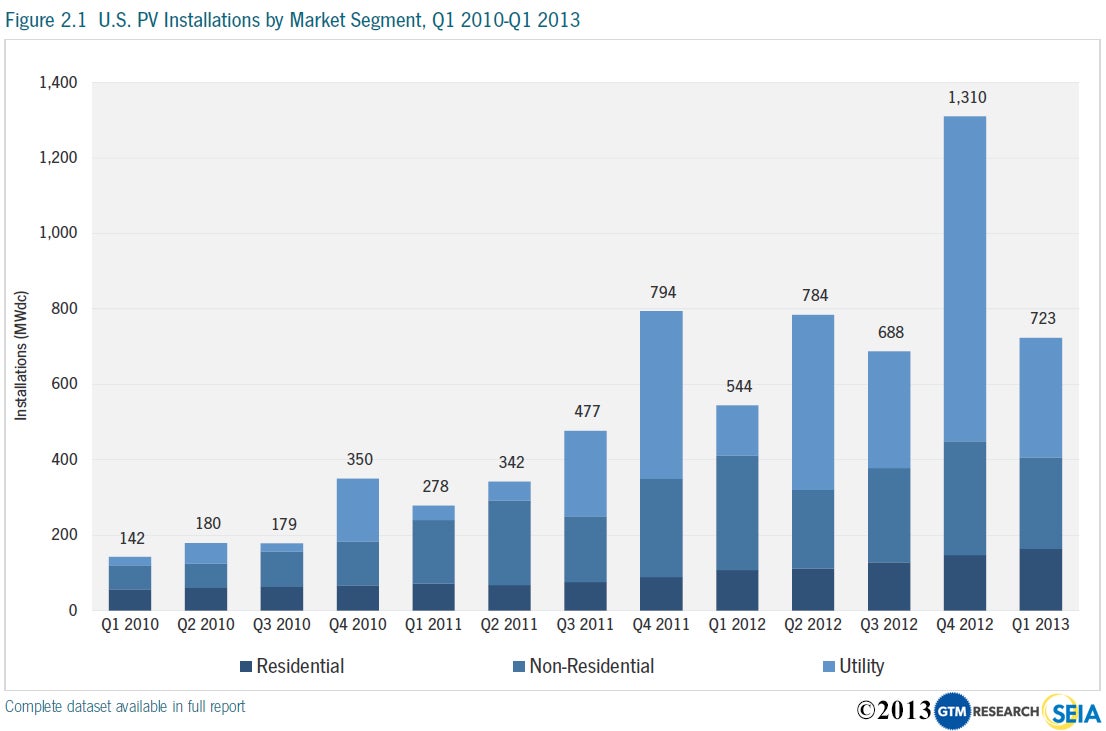
This year’s U.S. solar market had a strong first quarter of what is expected to be another record for the industry. Photovoltaic (PV) installations grew 33 percent over Q1 2012. Year-over-year, the residential market grew 53 percent, but the non-residential market was down 20 percent — reflecting the general outlook for the year. The non-residential market will take more time to adjust after being hit hard by a general decrease in state-level incentives.
While all segment predictions remain strong, the utility market leads the solar industry’s development. Despite utility installations decline from Q4 2012, they were up more than 130 percent from Q1 2012. This market generally experiences a boom in the fourth quarter and the SEIA expects the same pattern to hold in 2013.
Increasing Installations
- The U.S. installed 723 MW of PV in Q1 2013, representing a 33% growth over Q1 2012
- The U.S. now has over 8,500 MW of cumulative installed solar electric capacity—enough to power more than 1.3 million average American homes
- Twenty-four utility projects were completed in Q1 2013
- Utility market more than doubled year-over-year as 318 MW came online in Q1 2013
- The residential market continues its consistent growth—up 53% over Q1 2012
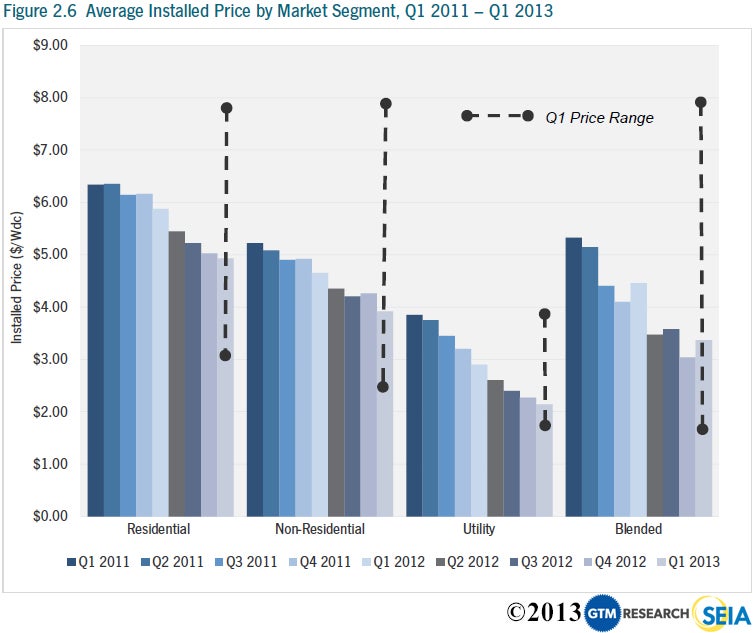
In early 2013, the solar market saw a continuation of average installed price declines across all types of installations; but it’s important to remember that PV prices vary greatly state to state and project to project. While the price declines are beneficial for solar end-consumers, the rapid fall in prices, due in part to a global oversupply situation, have put a significant strain on manufactures.
Decreasing Costs
- Year-over-year, the national average price decline over 24%, to $3.37/W
- Residential system prices fell 15.8 percent year-over-year
- Non-resident systems prices fell 15.6 percent year-over-year
- Utility systems from fell 26.2 percent year-over-year
- Since the beginning of 2011, the average price of a PV panel has dropped by more 60 percent
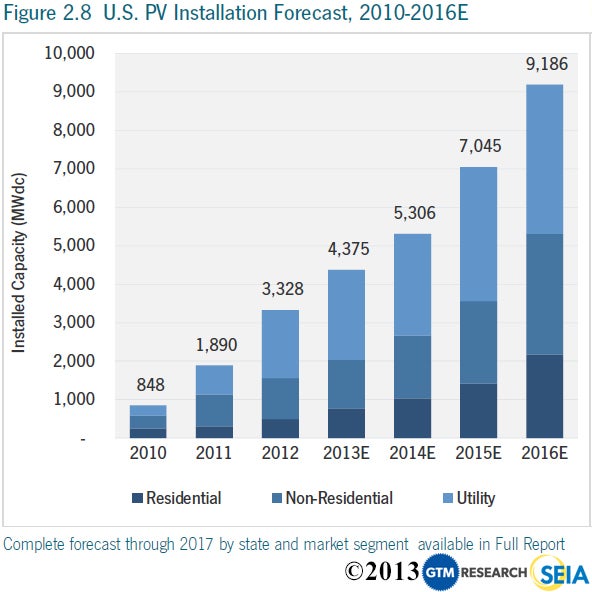
SEIA concludes that the PV market remained steady over the first quarter, with 4.4 GW expected to be installed in 2013 and growing to nearly 9.2 GW annually by 2016. The association predicts the most near-team opportunity for growth in the residential market. Predications are not so sunny for the commercial market, with only 18 percent growth in 2013. However, expected numbers are expected to increase in 2014 through 2016. Meanwhile, this year will be another record year for the utility market with 2.3 GW installed in the PV market.
A Bright Future
- More than 4,400 MW of PV will come online throughout 2013
- Together, new solar electric capacity added in 2013 will generate enough clean energy to power over 960,000 average American homes
- Most near-term opportunity for grown is in residential market
- The SEIA predicts solar will become cost effective in some markets with only federal investment tax credit, accelerated depreciation and net metering
The U.S. solar market is an economic engine. There are now 119,000 solar workers in the U.S., a 13.2 percent increase over employment totals in 2011. These workers are employed at 5,600 businesses in every state. The increasing value of projects has injected life into the U.S. economy as well. In 2012, solar installations were valued at $11.5 billion, compared to $8.6 billion in 2011 and $5 billion in 2010.
For more information on the solar industry or to download the SEIA U.S. Solar Market Insight, click here.