Reflections on the Growth of the Solar Industry
Last week, I discussed three statistics from the Solar Energy Industries Association (SEIA) that demonstrate the momentum of the solar industry. This week, with the World Renewable Energy Forum underway, I want to look more closely at industry statistics, particularly at the nonresidential and utility sectors.
Growing Pains
The solar market often appears to be taking two steps forward and one step back. Government incentives are still essential to this market, so when programs change or expire, they threaten to hinder growth. The expiration of the Section 1603 Treasury Grants at the end of 2011 is an important example. Of course, an industry bolstered by government incentives is subject to the whims of politics and perception. When a high-profile setback like the Solyndra bankruptcy makes headlines, it can damage public perception and threaten to erode federal and state support.
A Historic Year
The SEIA’s U.S. Solar Market Insight Report calls 2011 a historic year with solar installations booming and 1,855 megawatts (MW) of PV solar systems installed — a 109 percent growth over 2010. Of particular interest for construction and solar racking companies is the fact that nonresidential installations grew 127 percent and utility installations grew 185 percent.
The market is concentrated in only a few states, with California representing 29 percent of the installations, New Jersey representing 17 percent and the next five most active states comprising 34 percent. While this may seem and to suggest regional limitations on opportunity, the fact is that this market is still in its infancy. As it continues to make economic sense for businesses across the U.S. to invest in solar, they will — with or without government incentives. Indeed, in 2009 only two states installed more the 50 MW of capacity, in 2010 it was five states and in 2011, that number grew to eight states.

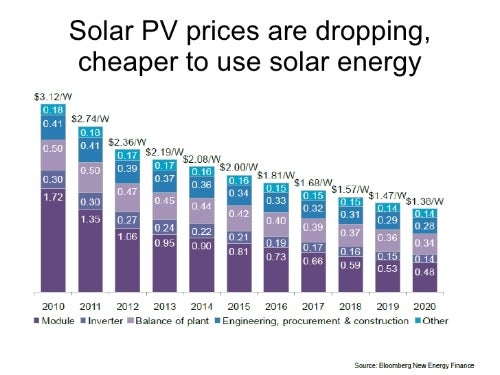
A Changing Cost Picture
While overall prices were down by 20 percent in 2011, a look at the Q4 2011 numbers shows how the landscape is changing for businesses — prices for nonresidential systems fell from $4.94 / W to $4.92 / W, and for utility systems prices fell for the seventh straight quarter, from $.345 to $3.20.
Investment
2011 will be remembered as the year the major players began to invest in solar energy. Some key investments in 2011 included: Warren Buffet’s purchase of MidAmerican Energy Holdings, owner of a $2 billion solar farm in California and Google’s $280 million dollar investment in a SolarCity tax equity fund to help fund solar projects. Excelon and NRG and also made major investments.
The Bottom Line
So what does this mean for the solar construction industry? It means opportunity and it means that solar developers, construction companies and racking manufacturers will need to find partners who can meet their needs as growth continues. A substantial amount of steel tube is required to support the infrastructure of every utility or nonresidential solar power project. The companies of the JMC Steel Group are committed to meeting this need — providing the capacity and flexibility to ensure the delivery of solar projects.
Clearly, this is an industry that will play an enormous role in the economy in the years to come. In future posts, we’ll continue to explore solar construction issues, including best practices and efforts to define and standards.