Cool infographic depicts 2013 Top 10 Solar States
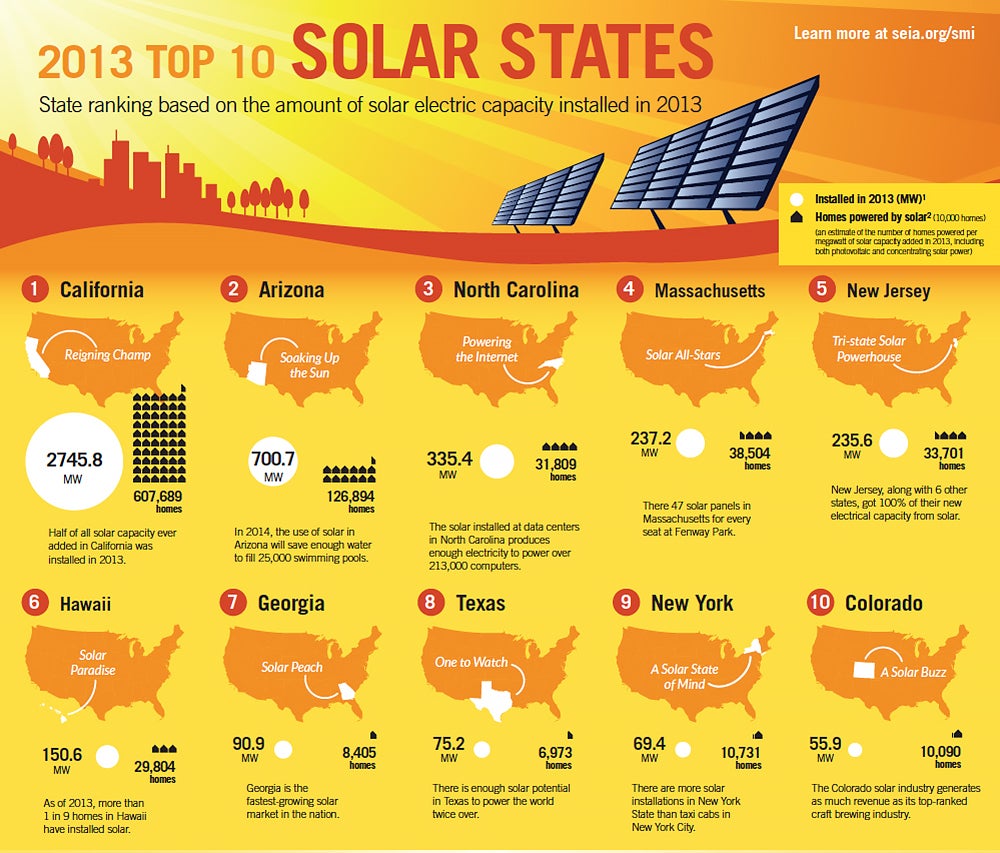
The latest infographic from Solar Energy Industries Association® (SEIA) ranks the Top 10 Solar States based on solar capacity installed in 2013. It also includes the number of megawatts installed per state, number of houses powered per megawatt of solar added, and facts about each state. SEIA also shows a remixed version of the rankings based on the number of solar jobs added in 2013, cumulative solar capacity, price decline in 2012-2013, and percentage of new electricity generation from
Solar.
Solar was the second-largest source of new electricity generating capacity in the U.S., exceeded only by natural gas. It is the first time in over fifteen years that the U.S. installed more solar capacity than Germany. Learn more at www.seia.org/research-resources/2013-top-10-solar-states
According to the SEIA, the U.S. installed 930 megawatts (MW) of photovoltaics (PV) in Q3 2013, up 20 percent over Q2 2013 and 35 percent over Q3 2012. This represents the second largest quarter in the history of the U.S. solar market and the largest quarter ever for residential PV installations. Even more importantly, 2013 was a first in over 15 years that the U.S. installed more solar capacity than world leader Germany, according to GTM Research forecasts.